A bond is a loan, with a maturity, that an investor/lender grants to a government, a company, or a general entity in exchange for compensation (in the form of a coupon and/or revaluation of the loaned capital).
To measure the expected return of a bond, you just need to see what you can earn if you buy a bond today and hold it until maturity.
The simplest case is represented by government bonds which, in theory, should be considered the most reliable market counterparts, with virtually zero default risk. Obtaining data on government bond yields is very simple – below are those published on the following site, updated daily:
In the following excerpt (Figure 1), it is shown what one would earn if today (data as of 31/10/2022) one decided to lend money to a government for 10 years (column ’10Y Bond Yield’). In the case of the German government (Germany), through the purchase of a Bund, it would be possible to obtain a gross annual yield of 2.124% in 10 years (obviously holding it until maturity).
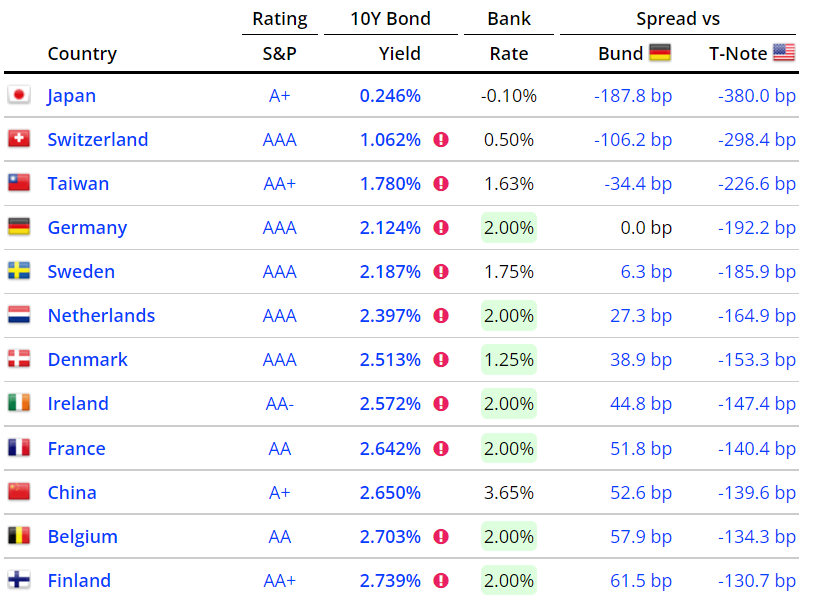
Figure 1 – Ten-year Government Bond Yields (excerpt). Source: World Government Bonds.
An annual yield of 2.124% over 10 years does not seem very interesting, but it should be considered that until a few months ago, the situation was less attractive.
To get an idea of how much less attractive, just click on the name of the country you intend to analyze. In the case of Germany, the data is shown in Figure 2.
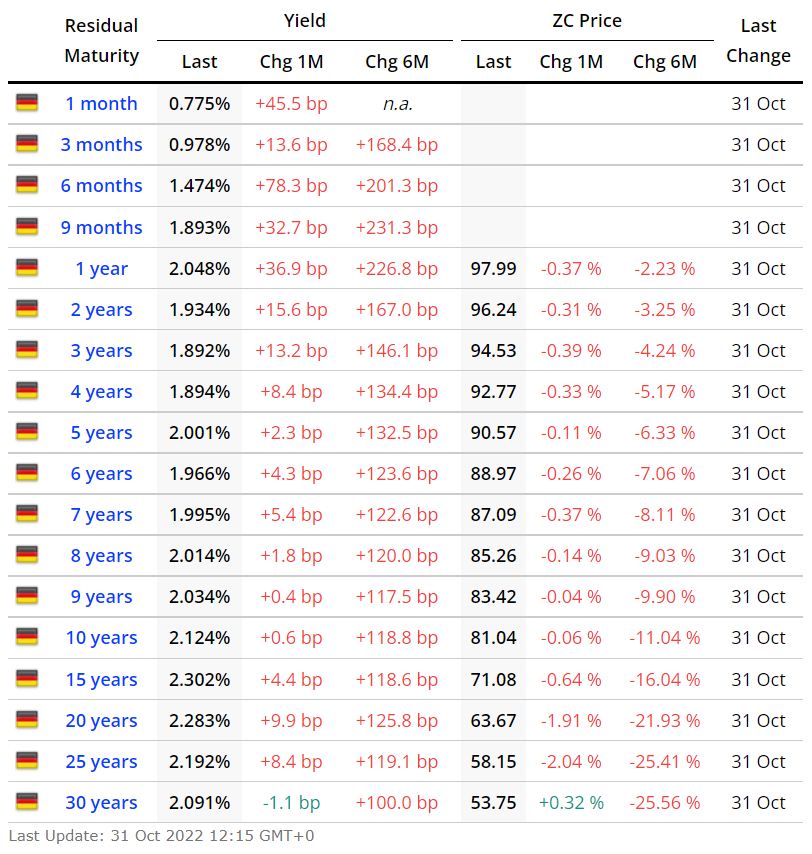
Figure 2 – German Bund Yields to Maturity. Data as of 31/10/2022. Source: World Government Bonds.
Referring to the 10-year row (‘10 years’), it can be noted that the gross annual yield to maturity of the Bund, equal to 2.124%, has increased by 1.188% per year compared to 6 months ago (column Yield|Chg 6M): it seems little, but it is more than double! No wonder, those who bought a 10-year Bund 6 months ago would now hold a bond whose price would have fallen by 11.04% (column ‘ZC Price|Chg 6M).
Referring to 1 year (row ‘1 year’), the current yield to maturity is 2.048%, up 2.268% compared to 6 months ago (in other words, the 1-year Bund had a negative yield six months ago, equal to -0.22%).
And so on for various maturities…
To complete the discussion, it is possible to obtain a graphical representation of what has been said above: the yield curve (Figure 3).
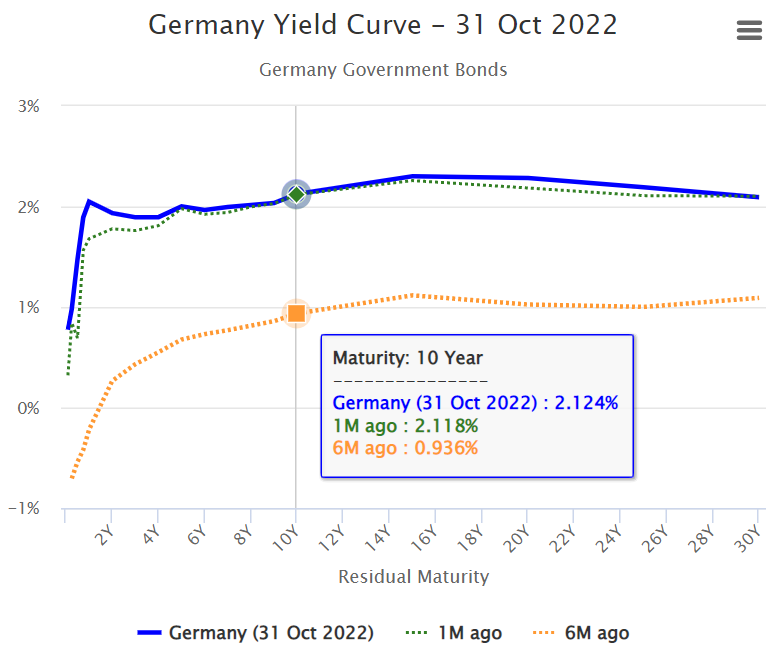
Figure 3 – Yield Curve, German Bunds. Data as of 31/10/2022. Source: World Government Bonds.
It can be noted that the blue line, which represents annual yields over various maturities, is always above the orange line, which represents the yields to maturity of 6 months ago. In the case of Bunds, the most significant rate increases occurred on short maturities, up to 2 years.
It is clear that the yield to maturity of a bond depends on the entity to which the capital is lent: the riskier the counterparty, the higher the remuneration required for the loan to take place.
Below, for reference, similar graphs and tables for Italy (Figure 4), the United Kingdom (Figure 5), and the United States (Figure 6) are shown.
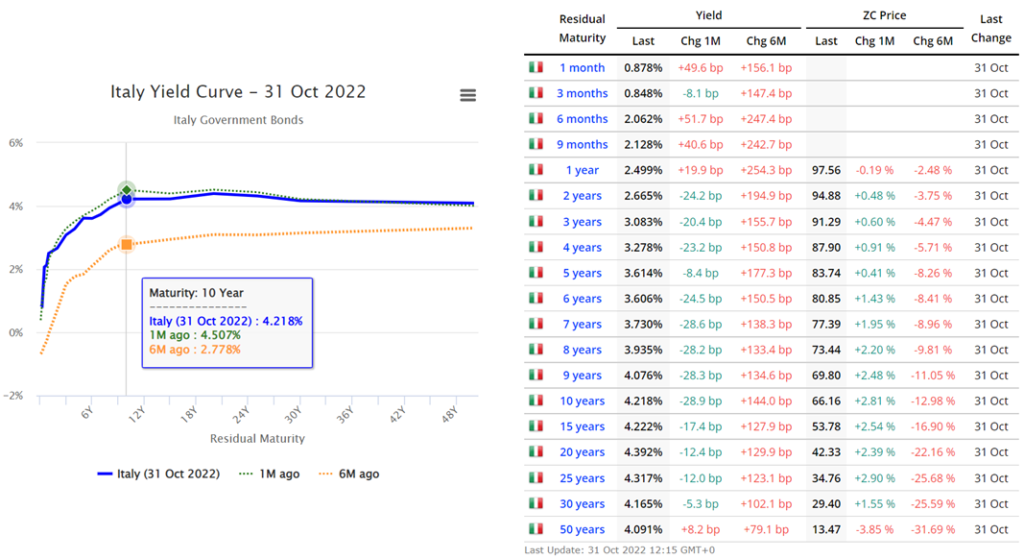
Figure 4 – Yields to Maturity, Italian Government Bonds (“BTP”). Data as of 31/10/2022. Source: World Government Bonds.
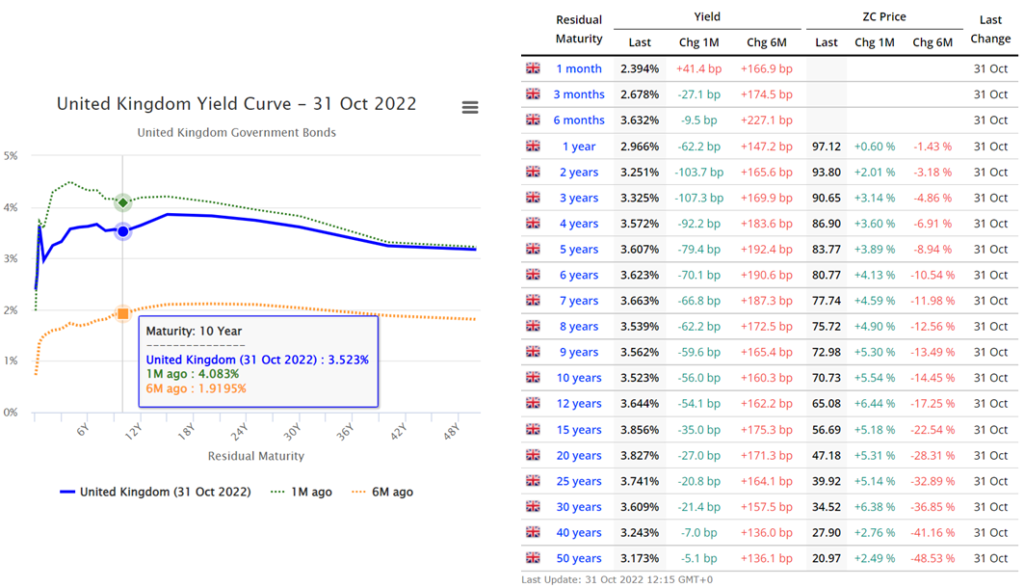
Figure 5 – Yields to Maturity, UK Government Bonds. Data as of 31/10/2022. Source: World Government Bonds.
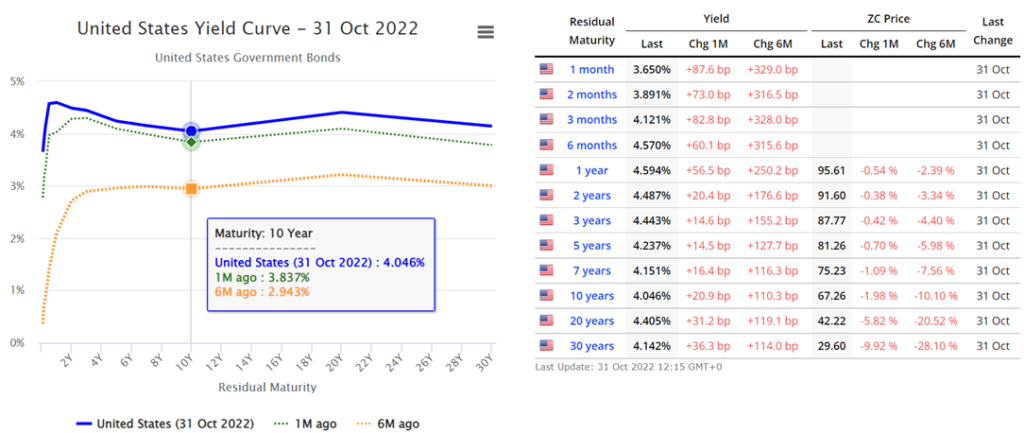
Figure 6 – Yields to Maturity, US Government Bonds. Data as of 31/10/2022. Source: World Government Bonds.
It is clear that yields to maturity vary every day. However, it can be stated that in the last 6 months, a significant regime change has occurred, bringing the nominal yields to maturity of government bonds of all countries into positive territory, even on short time horizons. Until a few months ago, this type of investment was considered taboo, meaning that, especially in Europe and on short horizons, it would have led to a certain loss (as many yields to maturity were negative).
Obviously, it is not said that a positive nominal yield is sufficient to cover inflation, but that is another topic, which will be discussed shortly.
Expected Returns of Stocks
A stock is an “instrument” that allows you to invest directly in the equity capital of a company, becoming its owner in all respects, even if with very small shares. It is clear that being a shareholder is very different from being a bondholder, as you actively participate in the company’s life without a specific maturity and without a guarantee of the return of the contributed capital.
For this reason, the shareholder will have a higher return target than the bondholder; otherwise, the investment would not make economic sense. Measuring this extra return is not a scientific operation as there are many variables at play, but there is a very simple model that allows capturing the most salient aspects: the CAPM (Capital Asset Pricing Model).
According to this model, widely used because it is simple and intuitive, the expected return of a stock (Ri) is equal to:
Ri = Rf + β x (Ri – Rf)
where:
Rf = risk-free return (in practice, the yield of a ten-year government bond)
β = coefficient of variation of the stock relative to the market (in practice, in the case of a diversified portfolio, this can be assumed to be 1)
Ri – Rf = risk premium (in practice, an annual return of 5% can be assumed as a starting point, at least for developed countries)
Applying these simple rules, the expected return of a diversified equity portfolio in the following countries could be estimated as:
- Germany: Ri = 2.214% + 5% = 7.2%
- Italy: Ri = 4.218% + 5% = 9.2%
- United Kingdom: Ri = 3.523% + 5% = 9.5% [in GBP]
- United States: Ri = 4.046% + 5% = 9.0% [in USD]
The calculated numbers, although they seem very precise, are in reality estimates that could be discussed for hours. However, they provide a starting point.
A slightly more elegant and comprehensive way to estimate expected stock market returns could be through the data published by Research Affiliates, a US research firm that regularly (and freely) publishes market estimates for various asset classes over a 10-year horizon (as they themselves are the first to admit they have no idea what will happen in one or two years):
The following chart (Figure 7) was downloaded from their website and represents the expected annual nominal returns (in euros) of the main stock markets over the next 10 years.
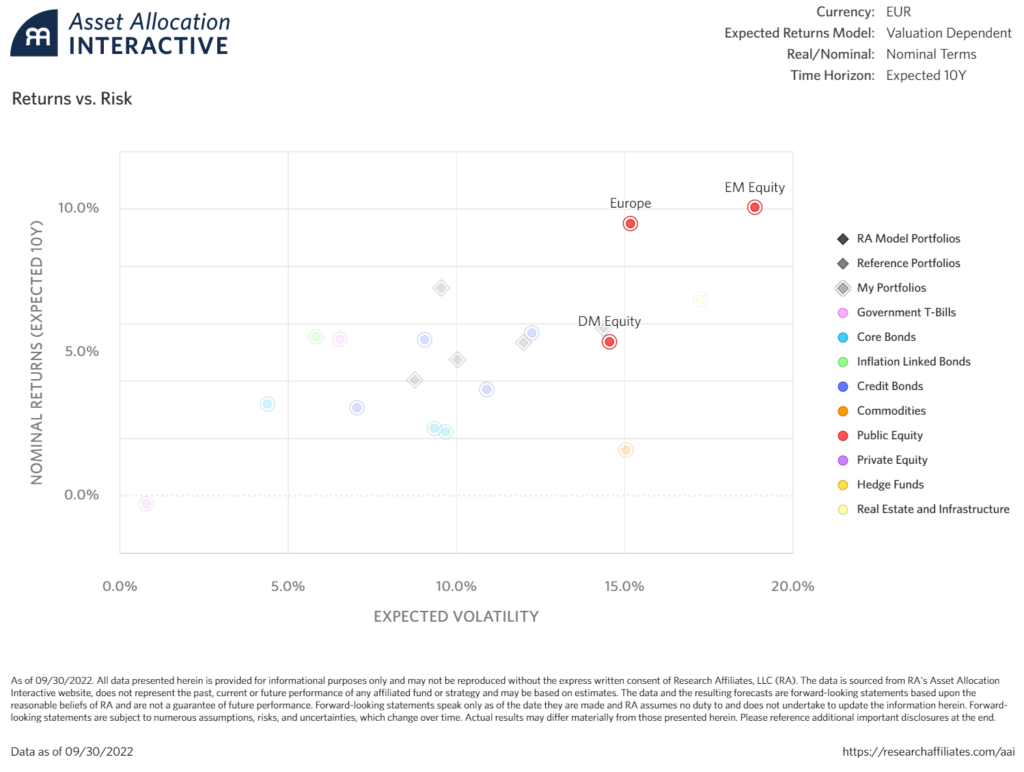
Figure 7 – Expected Annual Nominal Returns (in euros) of the Main Stock Markets over the Next 10 Years (estimates updated as of 30/09/2022).
Source: Research Affiliates.
At a glance, it can be seen that in the case of stocks, the expected returns for the next 10 years vary from 5% to 10% on average per year, depending on the market considered.
For the more curious, a table with all the expected returns for each country is also available, an excerpt of which is shown in Figure 8.

Figure 8 – Expected Annual Nominal Returns (in euros), by Country, of Stocks over the Next 10 Years (estimates updated as of 30/09/2022).
Source: Research Affiliates.
And Inflation?
All the expected returns discussed so far are expressed in nominal terms, i.e., without considering the effect of inflation, which, over time, erodes the purchasing power of one’s savings. The reason for having left out this component lies in the difficulty of estimating it, especially after the great volatility of this year. According to the index published by ISTAT, inflation in Italy in the first 9 months of 2022 was 6.87%, well above the historical average of 1.79% (annual average since the introduction of the single currency). Making an estimate, it would seem reasonable to assume, over the next 10 years, an average inflation rate of at least 2% per year, i.e., a level slightly higher than the historical average, given that in recent years inflation has been extraordinarily low (see the following chart, Figure 9).
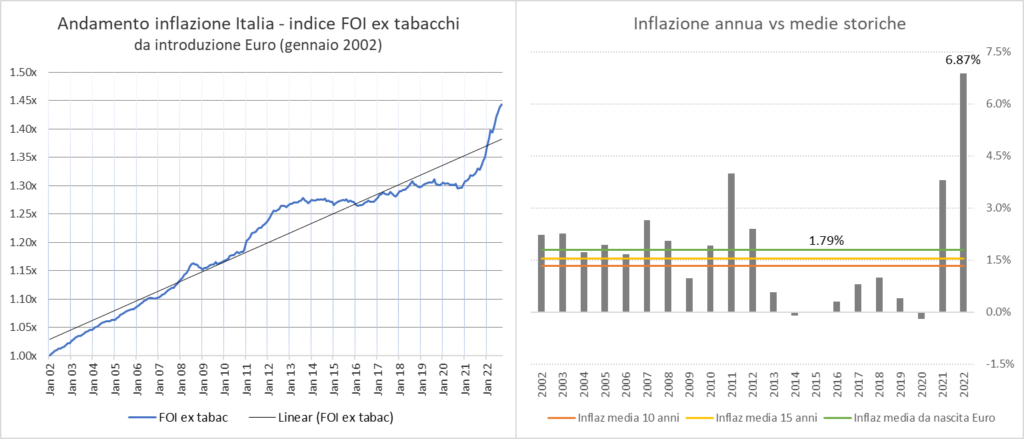
Figure 9 – Italian Inflation since the Introduction of the Euro (January 2002).
Source: Istat, data as of 30/09/2022. Data processing by Alberto Miazzi, CFA®.
Conclusions
This year we have moved from a market context of low inflation and moderate expected returns (in some cases negative, in the case of short-term European government bonds) to a new regime where even the least risky investment presents a positive “respectable” yield, even on short maturities. This new regime can be seen as a return to a more sensible economic situation, where those who invest can expect a positive return (compared to the previous context where the checking account was a winning alternative to low-risk investments on short maturities).
Due to a general decline in prices across all asset classes, the expected returns on bonds and stocks have risen significantly. While it is difficult to predict exactly what the expected return of an investment will be, it is possible to have a fairly clear idea of what the future direction will be.
In this insight, we have tried to provide some points to understand how to move across different time horizons and on which types of investments. Everyone should draw the conclusions they deem most appropriate…